History of Market: Heat Map The US stock market, on one screen.
History of Market: Heat Map draws every company in the S&P 500 as a tile. A tile’s size is the company’s market cap, its color is the price move over the time frame you choose, and the tiles are grouped by sector, so the shape of the market shows before you read a number.

 Scan with your iPhone camera



- Tile
- One company
- Size
- Its market cap
- Color
- Its move over the time frame
- Group
- Its sector, then its industry
Features
Read the whole market, then any part of it.
-
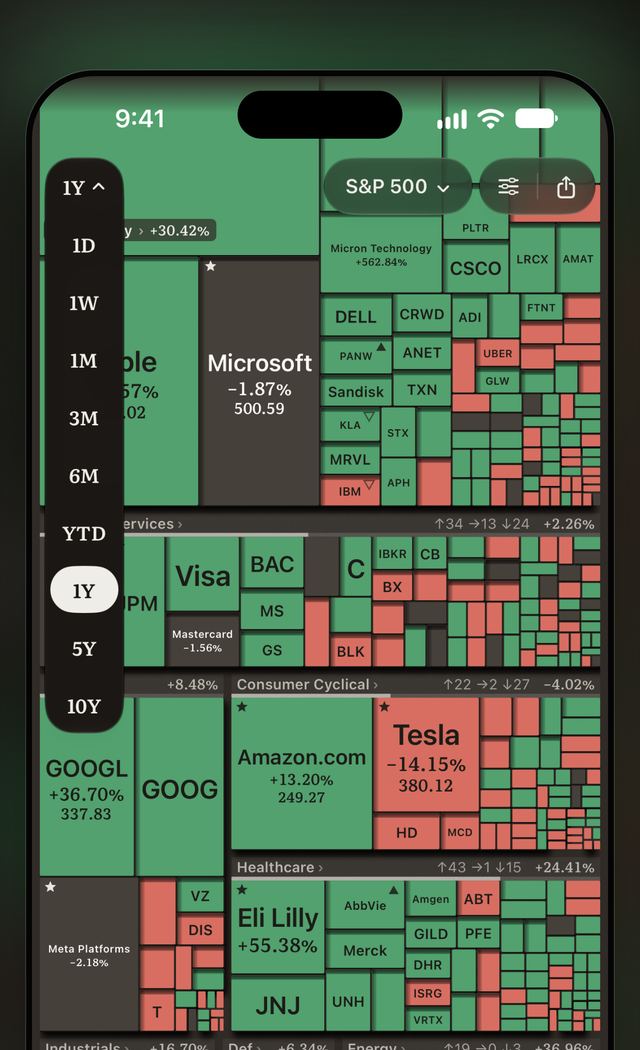
II Time frames
Every time frame, one swipe away.
Switch between 1D, 1W, 1M, 3M, 6M, YTD, 1Y, 5Y and 10Y with a swipe or from the menu. The colors change together, so a week, a year and a decade read the same way.
-
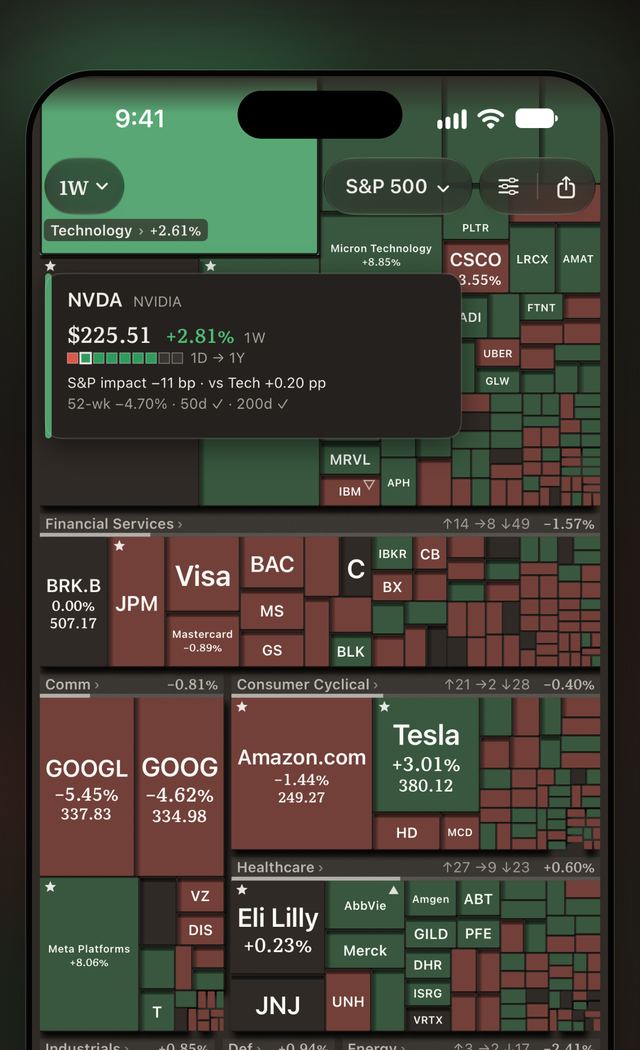
III Touch and hold
Hold any tile to read it.
Touch and hold a tile to see the company’s price, its move and its effect on the index. Slide your finger to read the tiles around it.
-
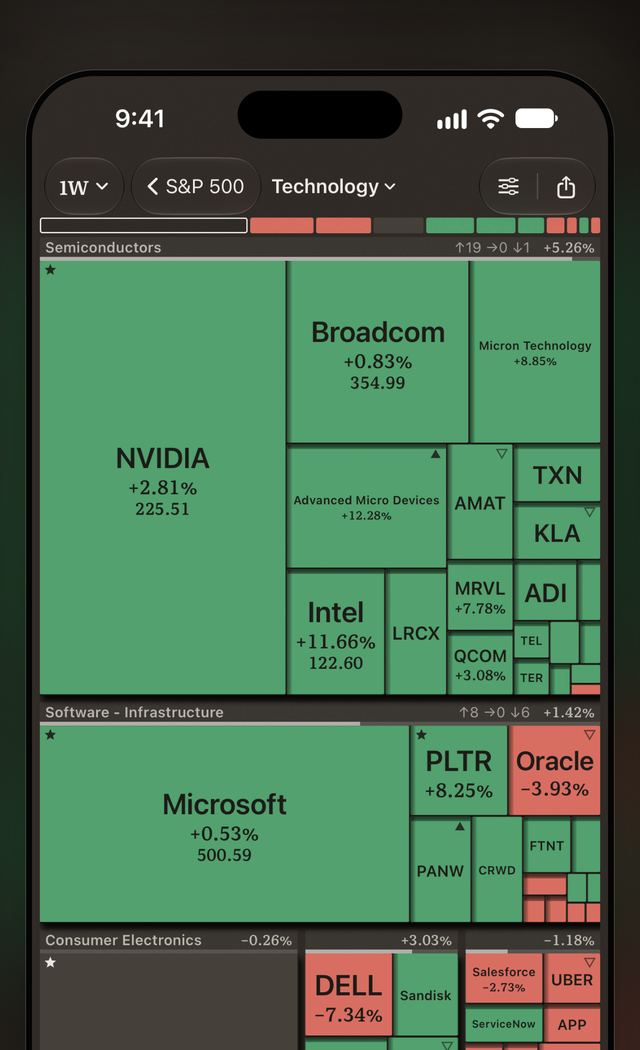
IV Sectors and industries
Open a sector. See every industry.
Tap a sector to fill the screen with its industries and companies. The app also shows market breadth and the stocks that pushed or dragged the index.
-
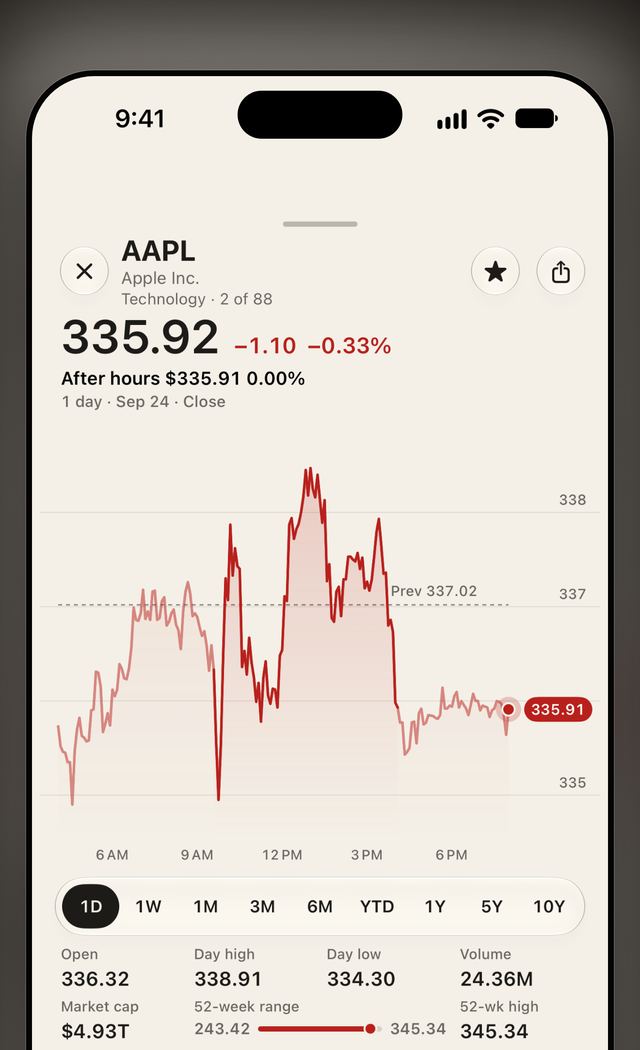
V Company page
Tap a tile. Open the company.
Price, chart, market cap, P/E (TTM) and P/E (NTM), each labeled with how it is calculated, and dividend yield. Star a stock to add it to your watchlist, then read the watchlist as its own heat map, a list or charts; it syncs through iCloud.
-
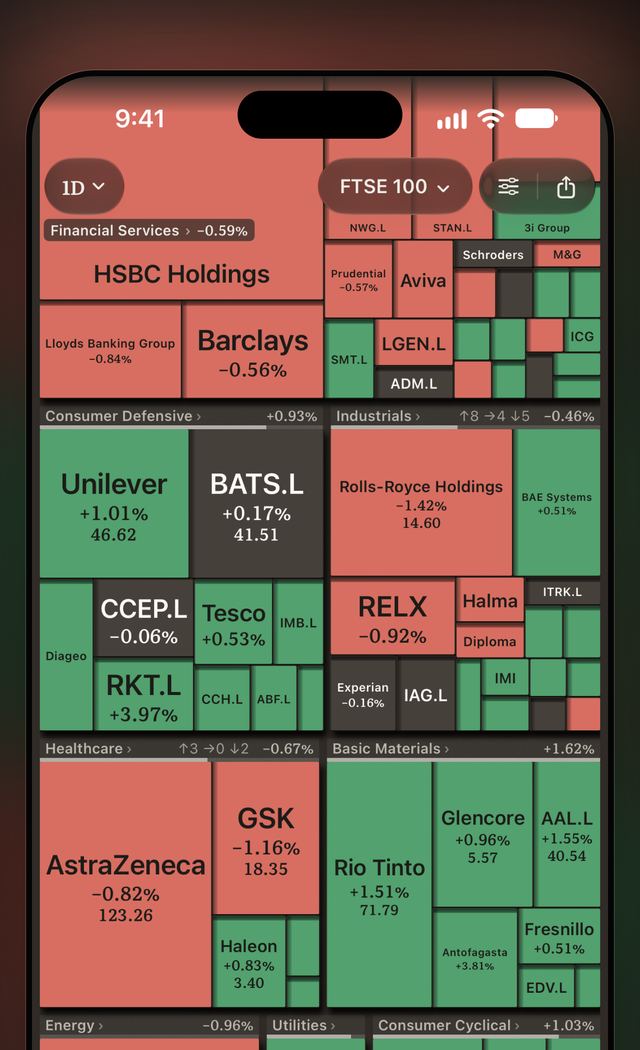
VI World markets
From Hong Kong to London.
Besides the S&P 500: the Nasdaq-100, Dow 30 and Russell 2000, all US stocks and US ETFs; the Hang Seng, CSI 300, Nikkei 225, KOSPI 200, Taiwan 50, Euro Stoxx 50 and FTSE 100; and one map of the world’s major companies. Every market is free.
-
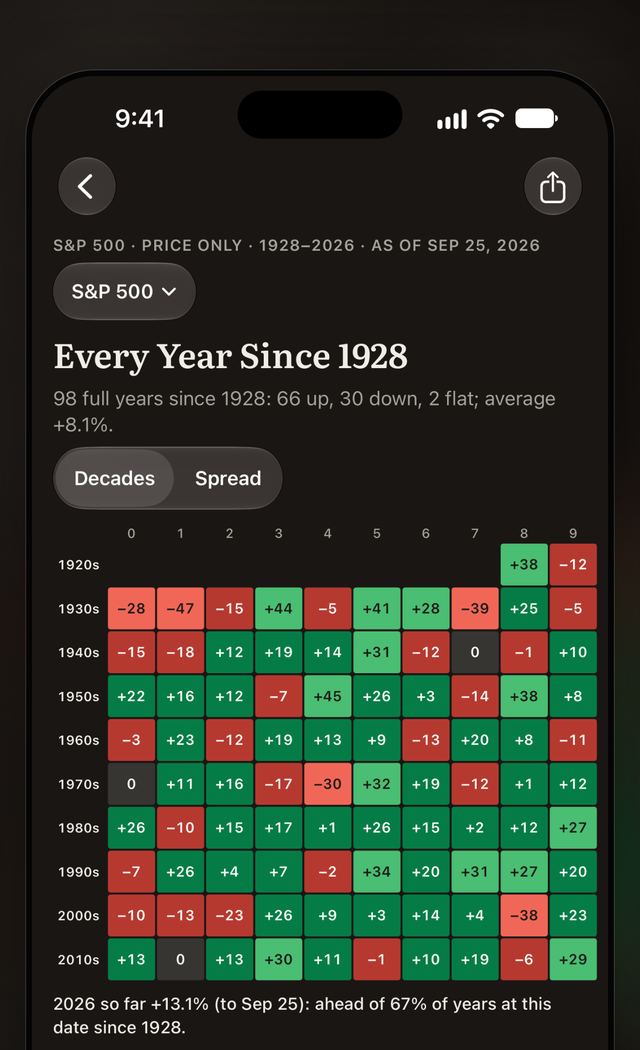
VII History
A century of the market.
Charts from historyofmarket.com inside the app: every year since 1928, every bear market, every fall and its recovery.
-
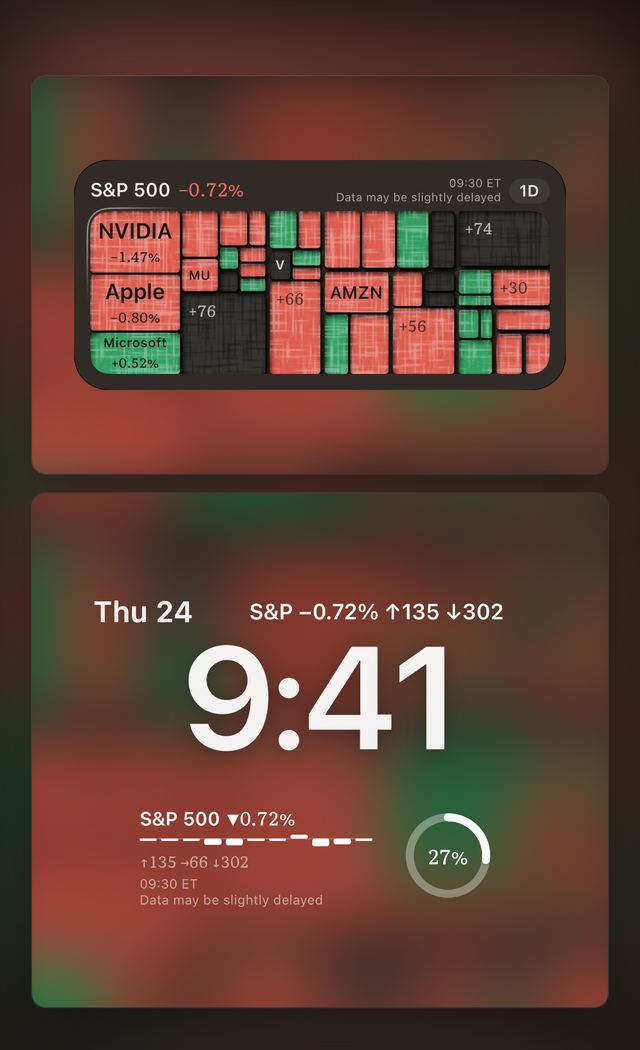
VIII Widgets
On your Home Screen and Lock Screen.
Market Map, Sectors, Watchlist and Movers on the Home Screen, S&P 500 widgets in three shapes on the Lock Screen, and a Control Center button. The medium Market Map of the S&P 500 at 1D and 1W, the Lock Screen widgets and the Control Center button are free; every other widget needs Supporter.
-
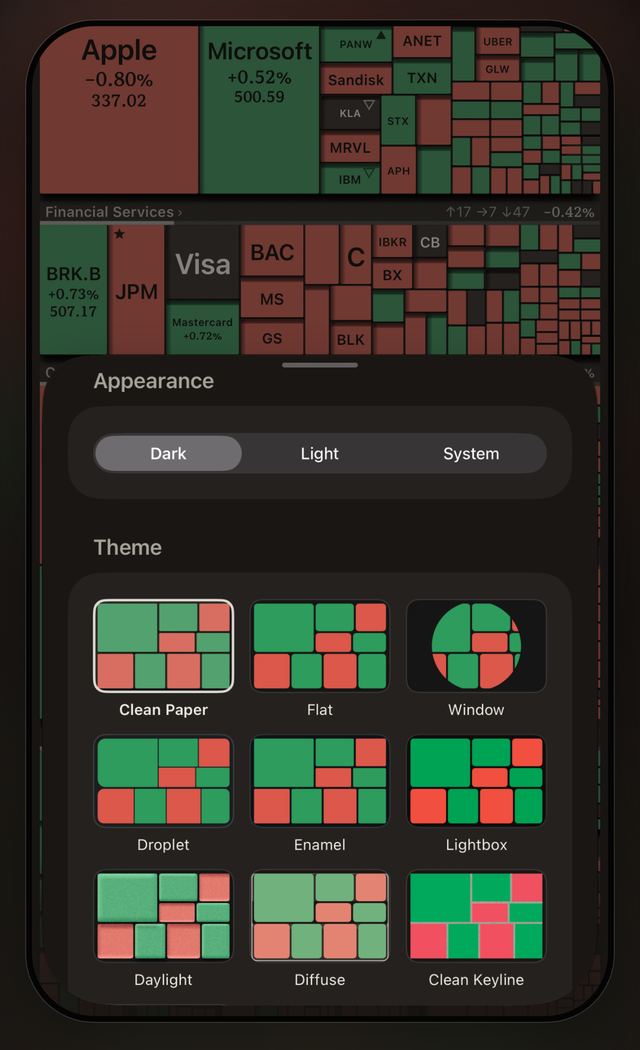
IX Themes and colors
Pick a theme. Pick your colors.
Green for up or red for up: pick the colors you read naturally, in light or dark mode. Themes such as Clean Paper, Droplet, Enamel, Lightbox and Daylight change the look of the whole map.
-
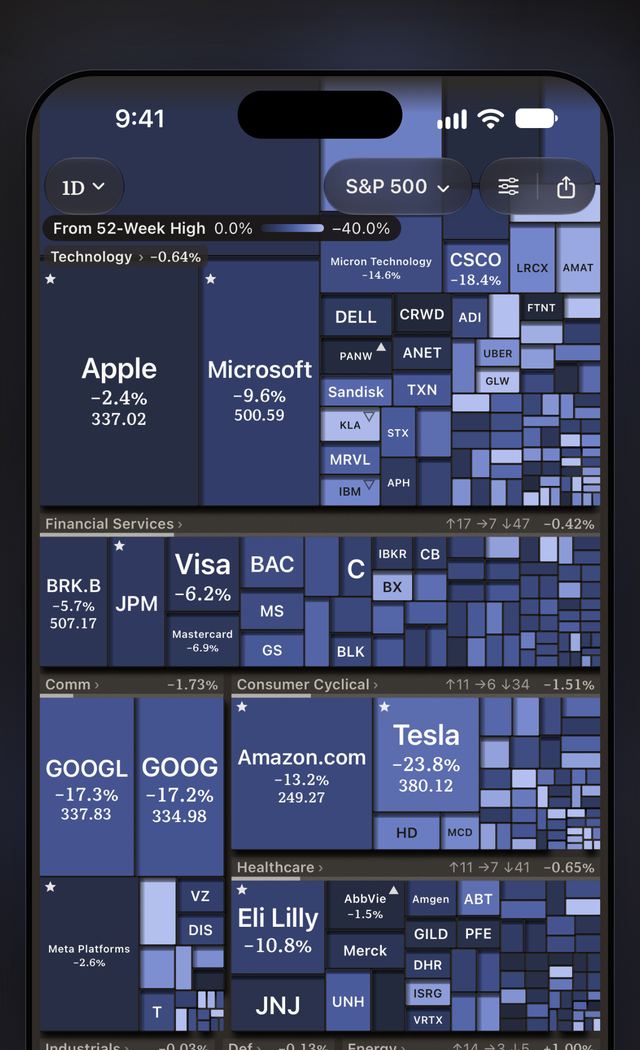
X Color lenses
Color the market by any measure.
Color the map by price change, P/E, P/S, P/B, dividend yield, distance from the 52-week high or low, relative volume or beta.


Layouts
Made for iPhone and iPad.
Layouts follow the window, from a narrow column to a 13-inch iPad. On iPad in landscape, the map and the company page sit side by side. VoiceOver, Dynamic Type and Reduce Motion are supported, in eight languages.

Questions
Questions and answers
- What is a stock market heat map?
- A stock market heat map draws every company in a market as a rectangle. The size of each rectangle shows the company’s market cap and its color shows how much the price moved, with companies grouped by sector. One look shows which parts of the market rose or fell and how much weight they carry.
- How do I see the S&P 500 heat map on iPhone?
- Install History of Market: Heat Map from the App Store and open it: the first screen is the S&P 500 as a heat map, grouped by sector. Swipe to change the time frame, tap a sector to see its industries, and touch and hold a tile to read the company.
- Is there a heat map widget for the iPhone Home Screen?
- Yes. History of Market: Heat Map has Market Map, Sectors, Watchlist and Movers widgets for the Home Screen and S&P 500 widgets for the Lock Screen. Touch and hold the Home Screen, tap Edit, then Add Widget, and search for Heat Map.
- Which markets does it cover?
- The S&P 500, Nasdaq-100, Dow 30 and Russell 2000, all US stocks and US ETFs; the Hang Seng, CSI 300, Nikkei 225, KOSPI 200, Taiwan 50, Euro Stoxx 50 and FTSE 100; and a global map of the world’s major companies. Each one opens as its own heat map, and every market is free.
- Is it free?
- Yes, the app is free to download. Every market, two themes, the 1D and 1W time frames, the choice of colors for up and down, one watchlist of 5 stocks, the medium Market Map widget and the Lock Screen widgets are free. An optional Supporter subscription unlocks every theme, time frame and widget, price alerts and more watchlists.
- Does it work on iPad?
- Yes. The app runs on iPhone and iPad with iOS or iPadOS 26 or later, and its layouts follow the window from a narrow column to a 13-inch iPad. On iPad in landscape, the map and the company page sit side by side.
Download
History of Market: Heat Map
Free to download: the App Store for iPhone and iPad, the Mac App Store for Mac, and Google Play or a signed APK for Android.
- iPhoneiOS 26 or later
- iPadiPadOS 26 or later
- MacmacOS 26 or later
- AndroidAndroid 13 or later
- Android without Google PlayAndroid 13 or laterDownload the APK
For phones without Google Play. The app tells you when a newer version is out.